
Forecasting the effects of world fleet decarbonisation options
A new GHG Pathway Model from the latest Maritime Forecast to 2050 report can help the maritime industry to assess and prepare for the effects of regulatory and technological change in reducing world fleet greenhouse gas emissions
Applying the GHG Pathway Model based on long-term trends, the report projects possible pathways for the world fleet size, fuel mix and CO2 emissions towards 2050 for the expected transport demand
“MEETING International Maritime Organization targets for reducing greenhouse gas emissions from shipping will take mandatory requirements for individual ships, and other policy measures to support the development and use of new fuels and technologies,” says Tore Longva, one of the lead authors of the Maritime Forecast to 2050, and Principal Consultant at DNV GL’s Regulatory Affairs section.
“This is a clear message that resulted when we asked our model what would happen when selecting various regulatory pathways for reducing GHGs from shipping. The findings are timely as the IMO discusses how to prioritise and decide which measures to pursue.”
Modelling the future world fleet and its emissions

The Maritime Forecast to 2050, one of DNV GL’s Energy Transition Outlook 2019 reports, takes its focus from the IMO GHG ambitions, and from growing external pressure on shipping to cut emissions. It examines how shipping may meet the GHG targets given various potential developments in energy efficiency, logistics and alternative fuels. Applying the GHG Pathway Model based on long-term trends, the report projects possible pathways for the world fleet size, fuel mix and CO2 emissions towards 2050 for the expected transport demand.
“We believe the results make this required reading for stakeholders in the maritime ecosystem,” Mr Longva says. “These include vessel designers, shipbuilders, shipowners, operators, charterers, makers of engines and storage systems, public and private developers of infrastructure such as bunkering and shore-based power for vessels in harbour, and for the banks, insurers and other finance sector players.”
The GHG Pathway Model assesses several future scenarios. The fleet development module adds and removes ships annually to balance fleet supply capacity against seaborne trade demand projections. The abatement uptake module evaluates available GHG reduction measures on all existing ships and newbuildings for each year. A feedback loop adjusts for ship speed reduction by adding new ships to maintain the fleet’s trading capacity. Another loop ensures that the uptake of technical measures and fuels in the fleet result in year-by-year reductions in the cost of future installations. This accounts for technology development and the effects of its maturation on the market.
A pathway to achieve fleet-wide carbon-intensity targets
DNV GL’s Maritime Forecast to 2050 describes the results for three modelled GHG pathways. Two of them focus on vessel design or operational requirements to achieve IMO ambitions. In both pathways regulations will be in place for individual ships to incentivise the necessary emissions reduction, but the specifics of the regulations differ.
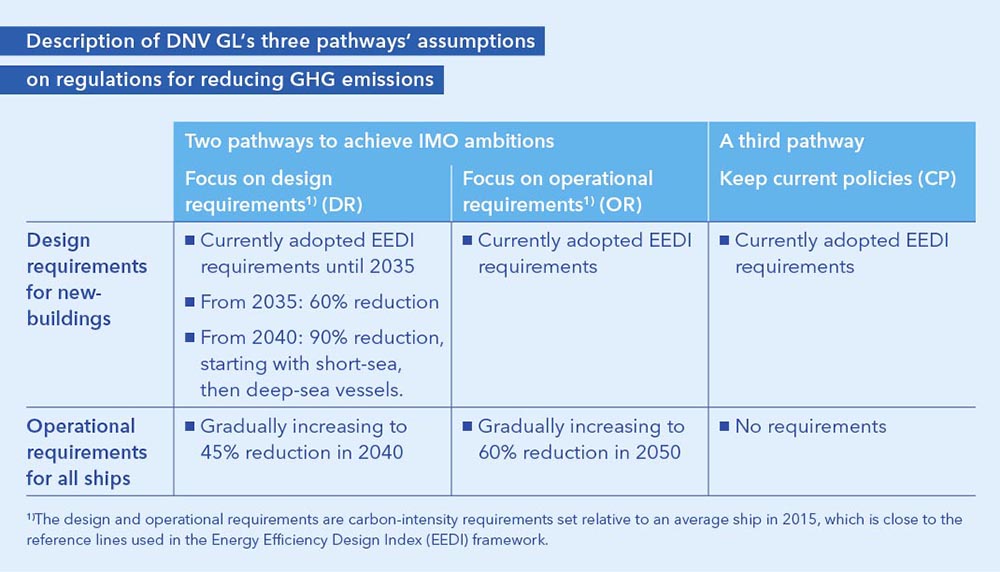
The first pathway assumes that current ships and those built over the next 20 years will not make a major shift to alternative, carbon-neutral fuels. In this scenario newbuildings will have to make a complete fuel shift from 2040 to reach the IMO targets. Under these assumptions the shipping industry will not have to consider retrofits and fuels compatible with current converters but continue to design newbuildings for the most relevant fuel. In the second scenario a more gradual improvement is enforced through operational requirements for ships in operation. Drop-in fuels such as advanced biodiesel and liquefied biogas are preferred to avoid costly retrofits.
A third “current policies” pathway describes what happens if no further policies are introduced. It assumes that the IMO will not issue any other requirements beyond the existing Energy Efficiency Design Index and the Ship Energy Efficiency Management Plan.
Carbon dioxide emissions from shipping towards 2050
Shipping emitted an estimated 921 megatons of carbon dioxide (MtCO2) in 2008, and 870 MtCO2 in 2018. If carbon intensity remains static, emissions in 2050 would be 1,210 MtCO2 based on the 39% growth in demand for seaborne trade projected by DNV GL’s Energy Transition Outlook
“In all pathways, we see a big impact of energy-efficiency measures and vessel speed reduction which can be achieved early in the period up to 2035,” Longva explains. “This is because these measures do not require renewing the fleet. We see emissions peaking in mid-to-late 2020.”
Without further regulation, a sufficient uptake of alternative fuels to meet IMO GHG targets is not expected unless prices for alternative fuels move to the same level as those for fossil fuels. For the “current policies” pathway, the forecast projects 670 MtCO2 of emissions in 2050, little more than a quarter (27%) below 2008 levels. In this case, carbon intensity ends at 8.2 gCO2 per tonne-mile, 62% less than in 2008. In the two pathways where IMO GHG targets are achieved, a carbon intensity of 5.6 grams of CO2 per tonne-mile in 2050 is projected, three quarters (74%) less than in 2008.
The results indicate that even with low to moderate seaborne trade growth, the IMO’s ambition for a 50% absolute reduction in CO2 emissions by 2050 is stricter than its 70% carbon-intensity reduction ambition.
Predicting the future energy mix of the world fleet
The total energy use in international shipping is forecasted to rise from about 10.6 exajoules (EJ) in 2018 to a peak value of 11.6 EJ (about 210 Mt of oil equivalent) in 2025. It will then decrease to 9–9.5 EJ in 2050, with the container (23%), bulk (16%) and tanker (13%) segments accounting for the largest shares.
Total energy use does not vary greatly between the modelled GHG-reduction pathways, though there are significant differences in the energy mix. In all the pathways, liquefied methane has a dominant share of 40% to 80% of the fuel mix in 2050 (see charts below for the design and operational requirement pathways). The primary energy source of the methane varies between fossil, biomass and other renewables.
Ammonia is the most promising carbon-neutral fuel option for newbuildings. Another alternative would be a gradual shift of existing ships relying on drop-in fuels compatible with current fuel converters, such as bio/electro-diesel replacing liquid fuels, or bio/electro-methane replacing liquefied natural gas. The preference for ammonia is due to the lower cost of the converter, storage and the fuel itself compared with H2 and liquefied biogas/synthetic methane.
Carbon-neutral fuels have to supply 30% to 40% of the total energy for international shipping by mid-century if IMO GHG ambitions are to be achieved.
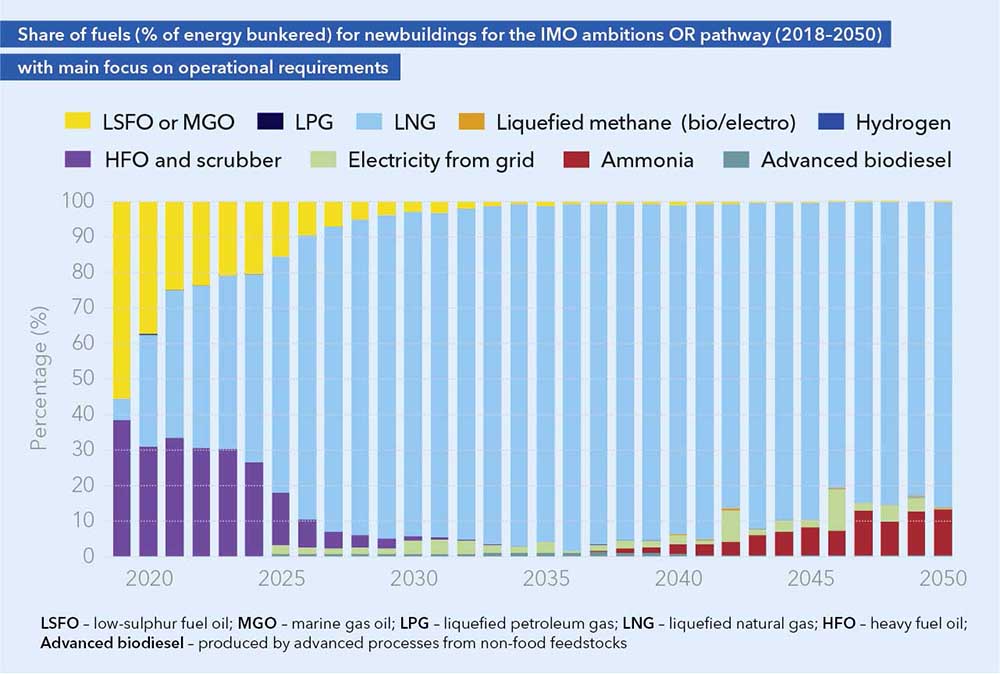
For the “current policies” pathway, the model anticipates a partial transition to other fuels, the energy mix in 2050 being 93% fossil fuels, specifically 50% LNG and 43% liquid fuels. High LNG uptake seen in all modelled pathways is driven largely by gas fuel prices, which are expected to drop towards mid-century.
Price favours HFO with scrubbers
In all scenarios, shore-based electricity provides about 5% to 7% of the total energy consumed by ships in 2050, delivered via batteries and shore-to-ship power. This amounts to 150 to 170 terawatt hours. The service and passenger segments will have the highest share, with almost 18% of their energy provided by grid electricity.
Use of heavy fuel oil with scrubbers depends largely on price differences between HFO, LNG and low-sulphur fuel oil/marine gasoil. In all modelled scenarios, the price favours HFO with scrubbers. In the “current policies” pathway, the share of HFO with scrubbers in the fleet fuel mix is 17%.
The cost and availability of HFO are further discussed in the Maritime Forecast to 2050, which also further develops DNV GL’s carbon-robust model for future-proofing vessels for new developments in regulation, alternative fuels, fuel converters and fuel-storage systems.
“Our modelling shows that achieving IMO GHG reduction ambitions is challenging but possible,” Mr Longva summarises. “Further modelling can be useful for policymakers and the maritime industry to anticipate the need for scaling up the supply of alternative fuels to satisfy the demand generated by new regulations.”