
Schedule Reliability: September Snapshot
Carriers’ schedule reliability wanes in 2H17, CargoSmart index reveals
CargoSmart analyzes schedule reliability of 24 ocean carriers across 12 trade lanes each month to provide insights about ocean carriers’ performance. Shippers can compare the market averages to their own experiences, and carriers can benchmark their performance. After new mega alliances went into effect in April, the start of peak season in June, and several severe storms in August and September, overall schedule reliability rose and then declined.
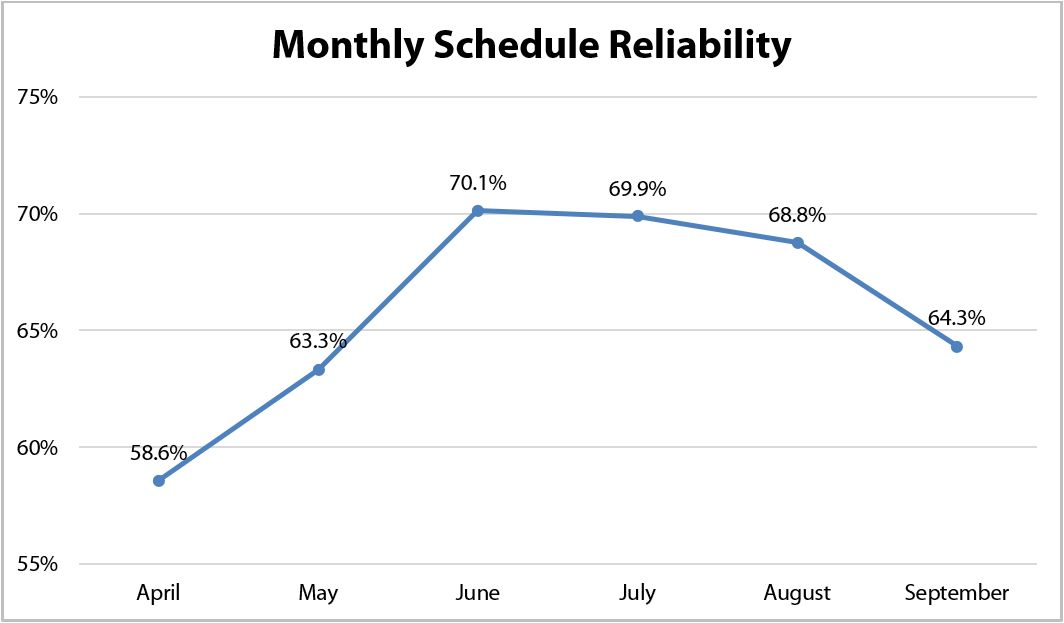
Overall Schedule Reliability Dips to 64.3% in September
Ocean carriers’ schedule reliability has had a decreasing trend since June 2017, from 70.1% in June to 64.3% in September, according to CargoSmart’s analysis*, as shown in Figure 1.
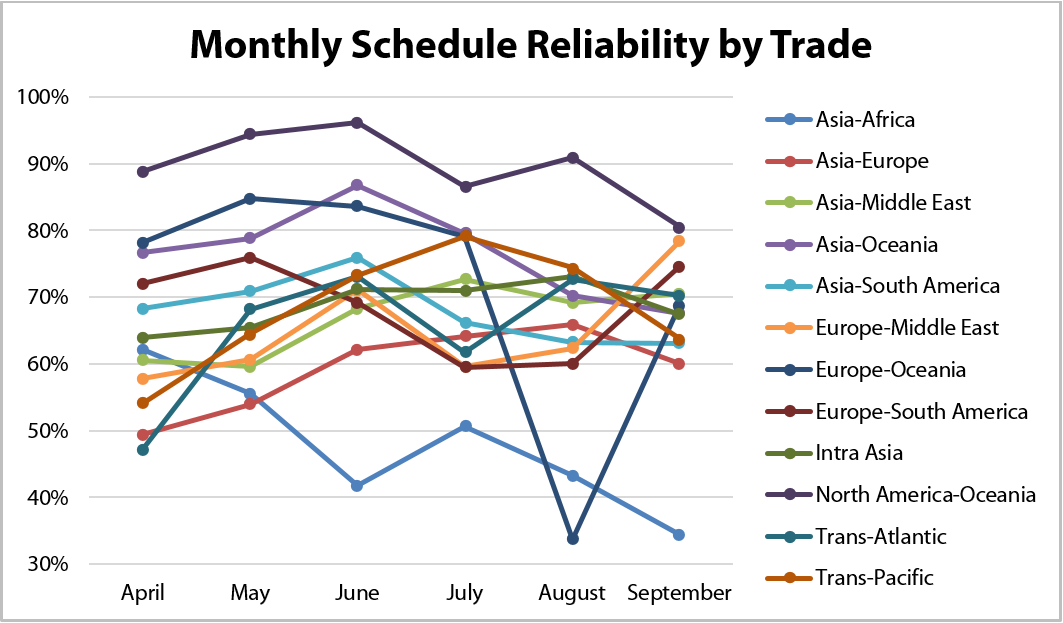
North America-Oceania Trade Has Highest Reliability for Six Months
Reviewing schedule reliability by trade, the North America-Oceania trade had the highest reliability over the past six months with reliability ranging from 80.5% to 96.1%, as shown in Figure 2. The Europe-Oceania trade experienced a large decrement in August but improved in September, increasing by 35.1%.
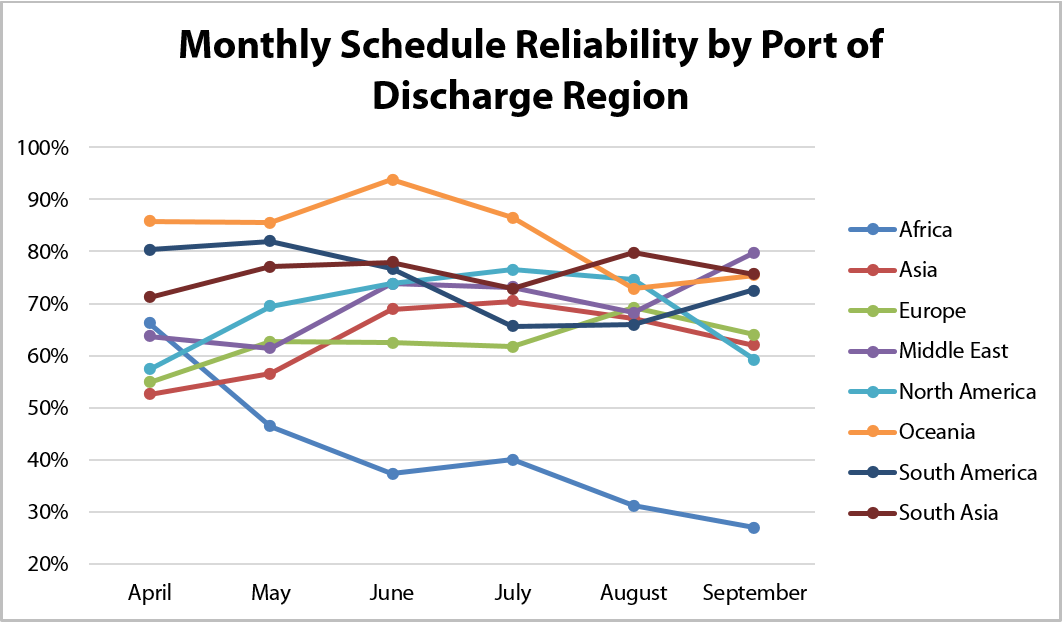
Schedule Reliability of North America Discharging Ports Drops in September
From the vessel discharging region perspective, as shown in Figure 3, the Oceania region had the highest reliability among the eight regions in most of the months with an average of 83.4% from April to September. Africa had the lowest reliability in most of the months and decreased to a six-month low of 26.9% reliability in September.
The North America region experienced a large decrement in reliability in September, decreasing by 15.4%, from 74.6% in August 2017 to 59.2% in September. Several hurricanes impacted container port operations in the North America region in late August and in September, contributing to lower schedule reliability in September.
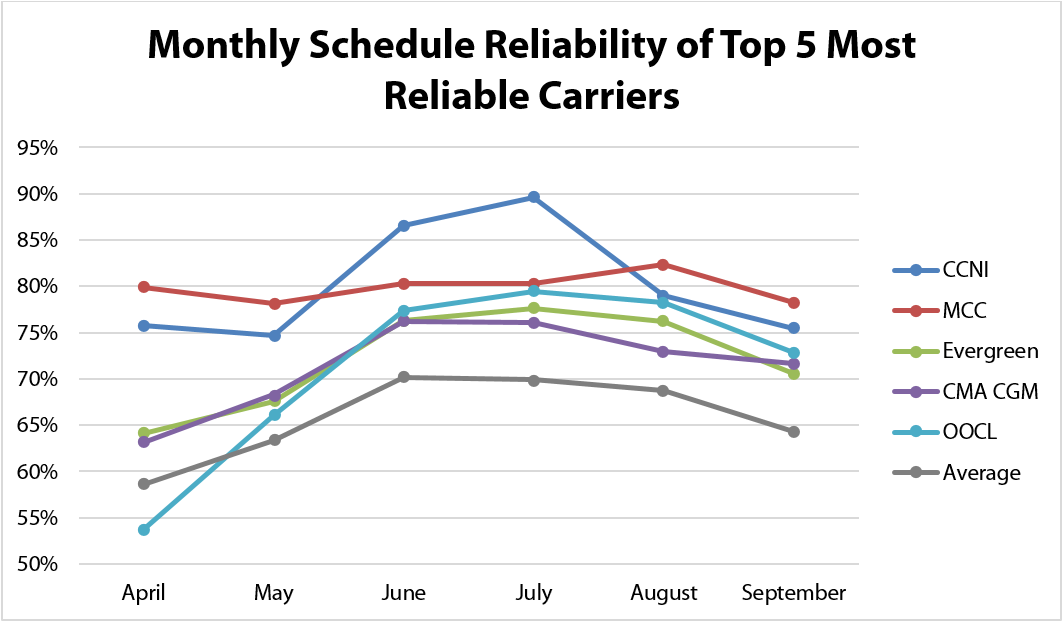
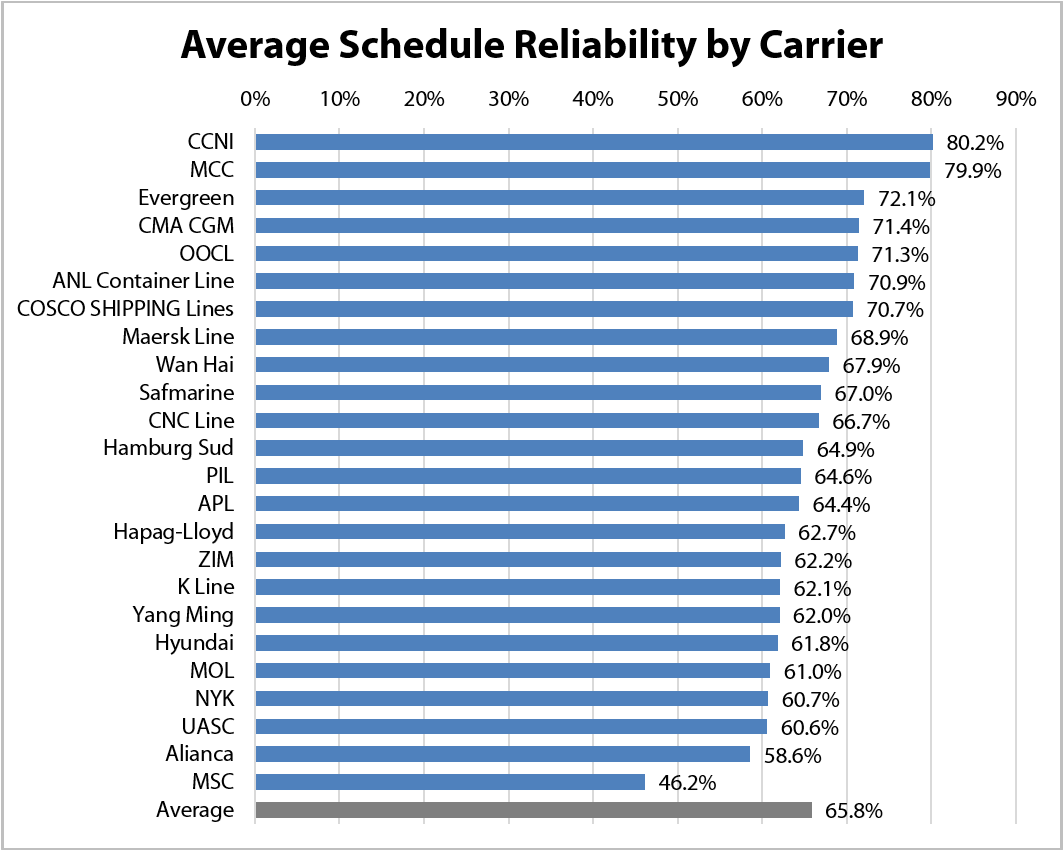
CCNI, MCC, Evergreen, OOCL, and CMA CGM Lead in Schedule Reliability April to September
Most of the 24 carriers experienced similar trend of schedule reliability from April to September 2017. Overall, the top five most reliable carriers from April to September were CCNI, MCC, Evergreen, OOCL, and CMA CGM with an average on-time performance of 80.2%, 79.9%, 72.1%, 71.4%, and 71.3% respectively, as shown in Figure 4.
Although MSC had the lowest reliability among the 24 carriers over the past six months, as shown in Figure 5, when taking a closer look at its performance on each trade, its reliability varied from 10% to 86%. It performed strongest in the North America-Oceania trade.
Schedule Reliability by Routes and Services
Reviewing carriers’ overall performance by trade provides a high level competitive landscape of how each carrier is performing on a specific route or service. Comparing carriers’ service offerings and performance are important for a more in-depth review of carriers’ service networks. If you are interested in reviewing carrier performance of specific routes and service offerings, you may contact CargoSmart at info@cargosmart.com to learn more about its solution, Carrier Intelligence.
*Schedule reliability methodology: CargoSmart provides schedule reliability information for up to 24 leading ocean carriers, covering over 19,000 vessel schedules, over 700 services, 77 major container ports, and over 1,400 port pairs around the world each month. The schedule reliability is determined by comparing the estimated time of arrival (ETA) and actual time of arrival (ATA) at the discharging port. A vessel’s ETA at the port of discharge (POD) is initially captured from the carrier when the vessel departs from the port of loading (POL). If the ATA is within plus or minus 24 hours of the ETA, then the vessel is considered to be on time. Reliability is calculated by dividing the number of on-time vessel arrivals by the total number of vessel arrivals within the measurement period.
Lionel Louie, Chief Commercial Officer, CargoSmart Limited. He can be reached at: info@cargosmart.com