
The Container Outlook
In a normal year, trade volume and capacity overheads alone would be enough to make life difficult for container lines. But the introduction of the sulphur cap from January 1 means the container sector alone faces a fuel bill hike in the region of $12bn-$20bn

Container trade is forecast to have increased by 2% to 1.3bn tonnes in 2019. In 2020, growth is projected to 4.9% driven by strong intra-Asian trade but also firm growth on the main trade lanes
TRADE wars and fuel surcharges are set to dominate container line conversations in the year ahead as the sector faces the twin challenges of slowing demand growth and rising costs.
At time of writing, the first signs of a tentative truce have emerged from Washington and Beijing with the agreement of the ‘Phase One’ deal that will see the delay or removal of billions of dollars of tariffs, just ahead of a fresh wave of tariffs that was due to come into effect on December 15.
Those tariffs would have struck at Chinese consumer goods imports to the US, the type of goods that are typically containerised, and which would have had a further impact on the transpacific trades.
But the damage this battle of wills has already done has been well documented, and tariffs still remain on $370bn worth of Chinese imports into the US.
After a rush of pre-tariff front loading before the January 1, 2019 tariff hike, transpacific trade has been on a downward trajectory.
Figures from the Port of Los Angeles showed a 12.4% year-on-year decrease in volumes in November, while neighbouring west coast import hub Long Beach also saw a downward trend.
The trade war has not just affected the transpacific trade, but has led to a global weakening of the trade on which all carriers depend.
This year’s peak season, in which carriers usually see volumes and rates rise as retailers stock up for the holiday season, failed to take off.
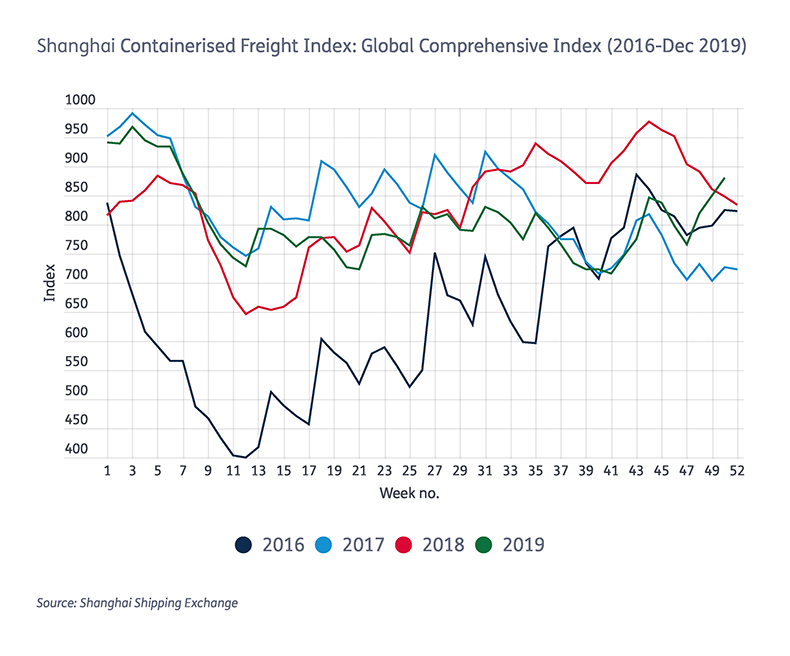
Freight rates have largely tracked below last year’s figure for most of this year, with only a late rush at the end of the year, as carrier efforts to remove tonnage, combined with the effects of an early Chinese New Year and the introduction of low-sulphur fuel adjustment charges, lifted prices.
Were it not for a large number of ships being taken out of service for scrubber retrofits leading to higher load factors, things would have been even worse.
Demand
The most recent figures from Container Trades Statistics show demand growing at just 1% this year. Drewry has been forced to twice revise down its expectations for container port throughput for the year and the International Monetary Fund has put global economic growth at just 3%.
In the past, when a multiplier factor could be applied to world GDP, 3% growth could have meant 6% or greater container freight growth. Even between 2011-2019, the multiplier effect has been 1-2. This year, it has fallen back to 0.3 as protectionism and a global slowdown affect growth.
It is too soon to tell whether this is a blip in the data, part of a cycle, or a major structural change in the world economy. But given that everything that can be containerised probably has been, and that China, which has driven the sector for so long, is shifting its economy from production to consumption, it could be argued that the days of rapid growth are over.
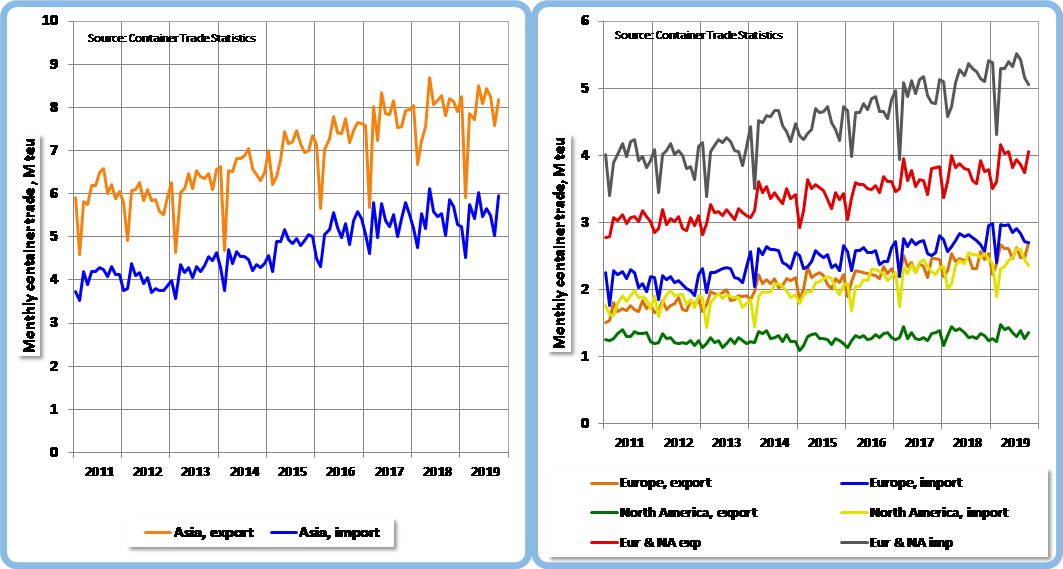
Monthly container trade, m teu (laden)
Lloyd’s List Intelligence figures show growth in container trade is projected to grow 4.6% annually until 2024. This will be partially driven by increased containerisation of cargoes.
Oversupply of capacity is expected to remain over the next couple of years at least, leading to lower container freight rates and lower earnings for carriers.
But this in turn increases the attractiveness of using containers, hence more cargo will find its way into boxes and support volume growth.
The biggest potential for further containerisation is to be found in forest products and scrap metals, and partially completed, or knocked down, cars.
Currently, the main commodities traded in containers are chemicals (20%), food & beverages (15%), consumer goods (13%) and forest products (11%).
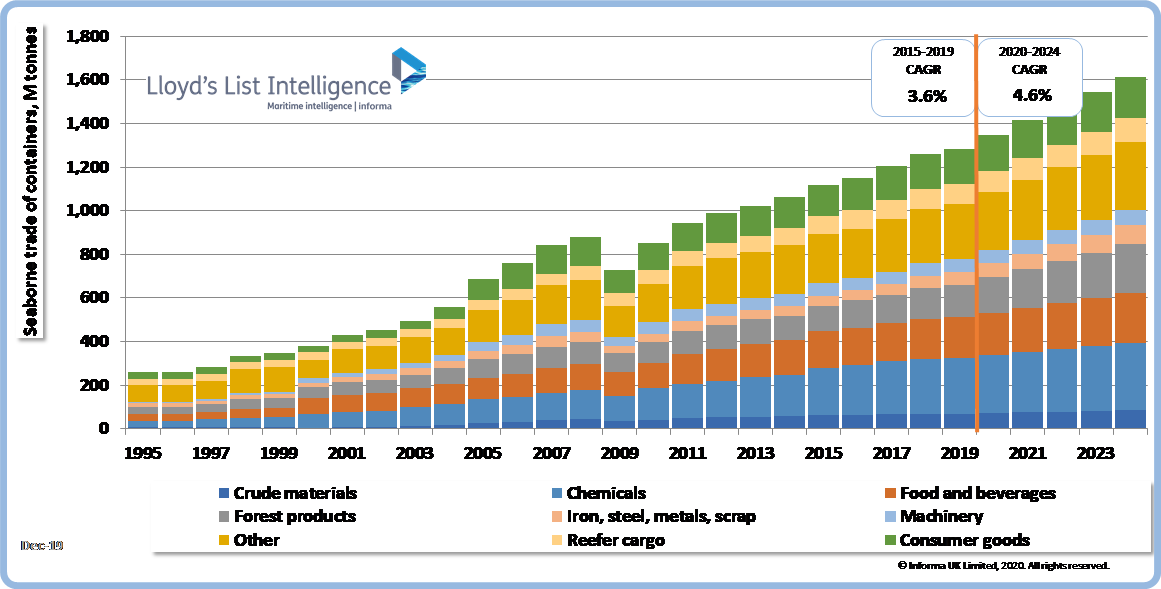
Seaborne trade in container, tonnes (m)
Container trade is forecast to have increased by 2% to 1.3bn tonnes in 2019. In 2020, growth is projected to 4.9%. The growth is driven by strong intra-Asian trade but also firm growth on the main trade lanes. The average annual growth rate during the past five years has been 3.6%. Over the next five years, growth is forecast to be higher at 4.6% annually.
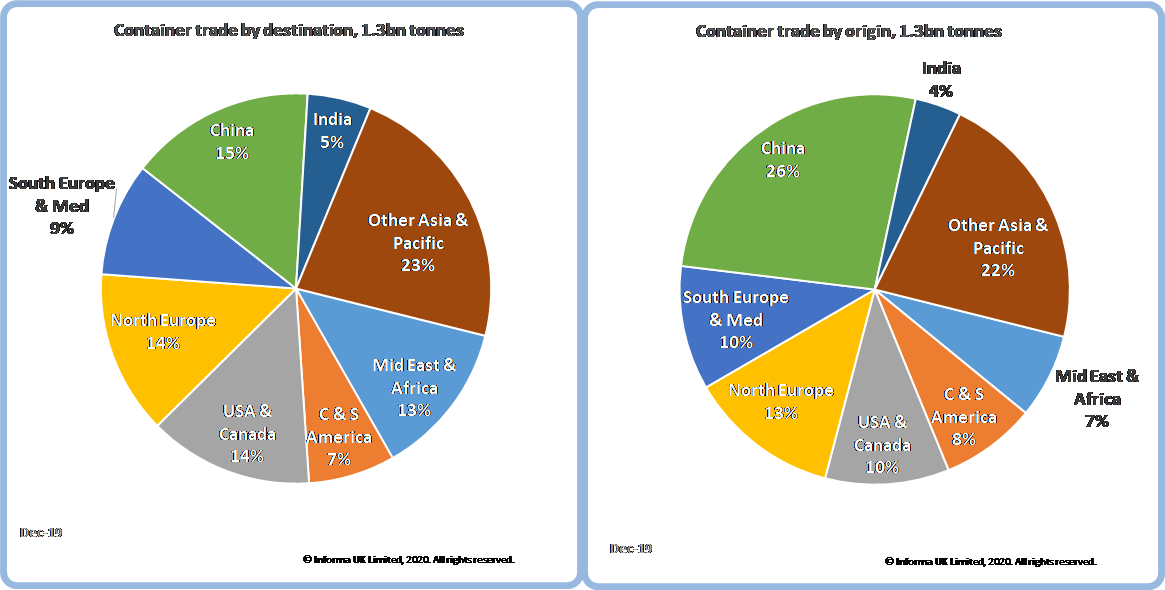
Container trade by destination and origin
Volumes handled by ports increased by 5% to 789m teu in 2018, with ports China accounts for 31% of the volumes, followed by Southeast Asia with 19% and Europe with 16%. Over the past 10 years the compound annual growth rate has been 4.1% and 261m teu has been added since 2009. During the first half of 2019 the growth has slowed down to around 2%.
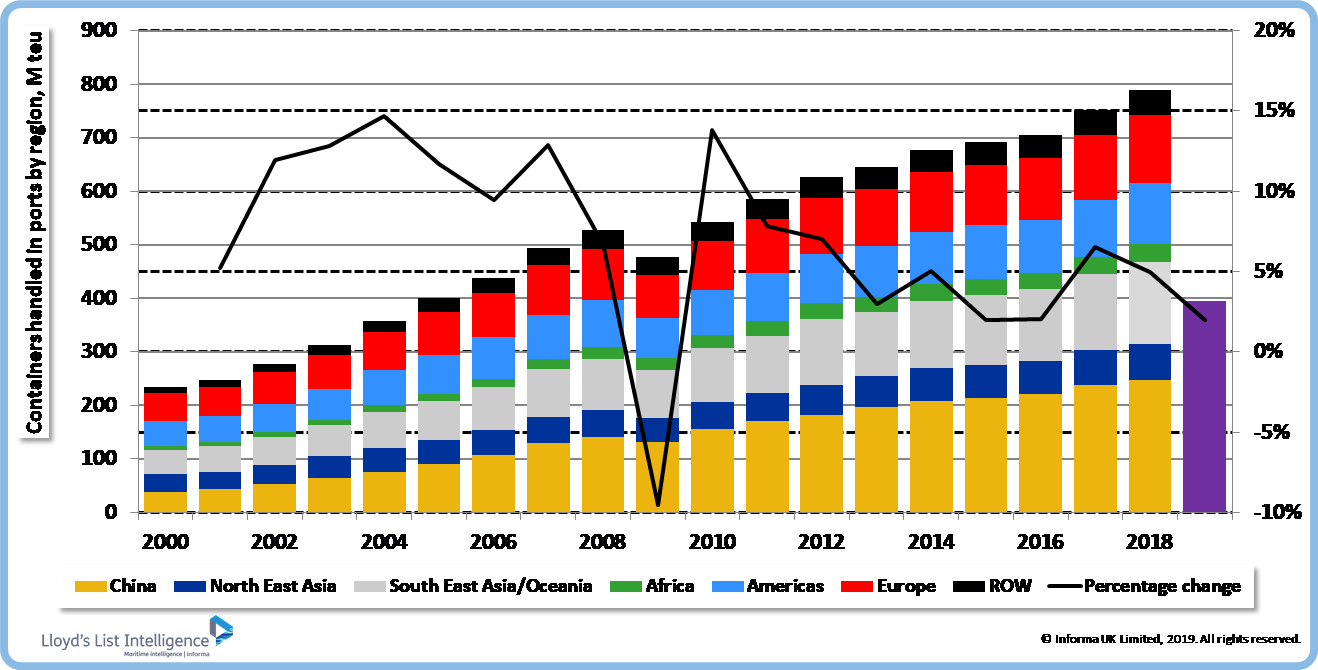
Global container port through put, teu (m)
Vessel supply
On the plus side for carriers, the supply side of the equation has eased, with fewer new ships coming into the fleet.
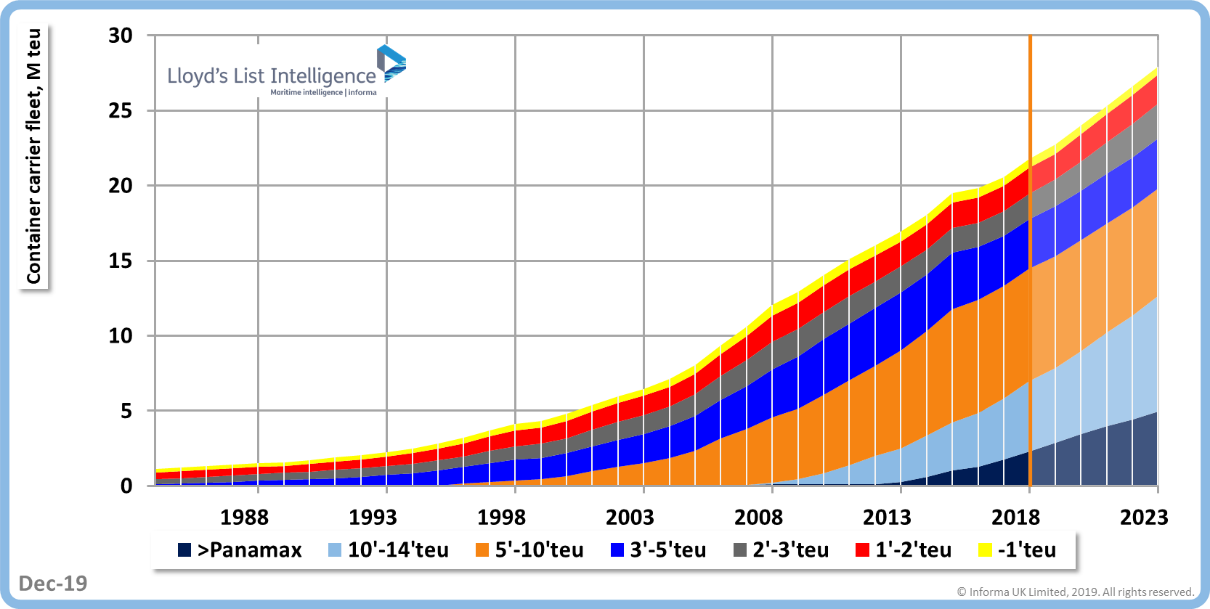
Container carrier fleet, teu (m)
Orders for new vessels in the past four years have been subdued. Despite some notable exceptions, for the most part, carriers have stayed away from the yards, and have certainly avoided the rapid fleet expansion seen in the years up to 2015.
Carriers have been keen to point out that the orderbook is coming back into equilibrium, claiming that at around 10% of the existing fleet, growth in capacity will be manageable over the next few years.
But figures from Lloyd’s List Intelligence, based on the long-term orderbook and including options for vessels not yet contracted, put the orderbook at 4.2m teu, representing 18% of the existing fleet of 22.6m teu.
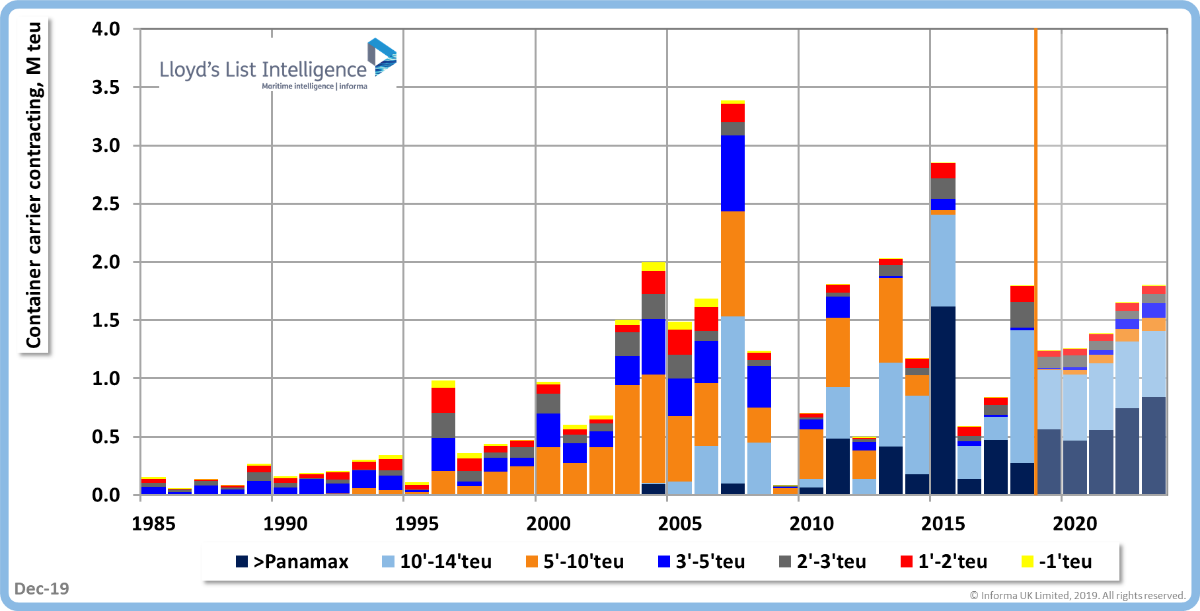
Container carrier contracting, teu (m)
New orders for container carriers are forecast to 155 vessels in 2019, a significant decrease compared to 2018 but new orders per year are to increase up to 230 vessels in 2023.
In total, 945 containerships are forecast to be ordered in 2019-2023, which is an increase of 110 over the previous five years. This corresponds to 7.4m teu, an increase of 100,000 teu.
In 2019 the deliveries of container carriers are forecast to 1.2m teu or 178 vessels, a decrease of 14% compared to 2018. Total deliveries in 2019-2023 are forecast at 7.2m teu, which is 10% more than in the previous five years. In the years to 2023, 1,086 boxships will be delivered, of which 371 will be larger than 10,000 teu.
Containership fleet expansion has been driven by the move to ever-larger tonnage as carriers seek more efficient vessels with lower slot costs.
This can be seen in the orderbook as well, where capacity on order for vessels over 14,000 teu represents 46% of the existing fleet.
The containership fleet capacity will reach 27.9m teu by 2023, growing at 5.1% annually on average over the five-year period.
But the race for capacity for its own sake appears to be over for the most part. Maersk, which for years drove the move to larger vessels, has stayed away from the yards and appears to remain committed to remaining that way, to the point of letting rivals close in in terms of vessel capacity.
Others, however, such as Mediterranean Shipping Co, Hyundai Merchant Marine and Evergreen continue to order big ships either as part of fleet renewal programmes or to fulfil alliance commitments.
At the other end of the vessel lifecycle, demolition is expected to have culled 103 vessels comprising 201,000 teu in 2019, up 38% over 2018.
The forecast is for 1.1 m teu of container capacity to be removed from the market in 2019-2023, which is 37% less than in the previous five years. In number of ships the removals will total 497 vessels, a decline of 186 ships compared to the past five years. Nearly half of the removed capacity will be in 5,000 teu-10,000 teu segment.
IMO 2020 impact
In a normal year, trade volume and capacity overheads alone would be enough to make life difficult for container lines.
But the introduction of the sulphur cap from January 1 means the container sector alone faces a fuel bill hike in the region of $12bn-$20bn.
For a sector that has failed to make an aggregate profit since 2010, those costs would be crippling and carriers were quick off the mark to say that customers would have to pay.
Carriers have taken different approaches to dealing with IMO 2020. MSC has invested heavily in scrubber technology, banking on a wide spread between low-sulphur fuel and traditional 3.5% fuel, which it will still be able to use.
Maersk, which initially rejected the notion of putting “refineries” on ships, is now hedging its bets and installing scrubbers on a number of its ships, although its preference remains to use compliant fuel.
CMA CGM has taken perhaps the most drastic step and ordered a series of ultra-large containerships that will use LNG as a fuel.
Each of these options costs money that that will need to be recouped from carriers’ customers.
All lines have introduced some form of bunker recovery fee, but heading into 2020 the question will be how long industry discipline can be maintained.
With slowing growth and fleet capacity that is continuing to grow, albeit more slowly than in previous years, slots still need to be filled. It will take just one carrier to break ranks to offer a lower baf, or to discount a freight rate, for the whole edifice to fall.
Lay up
One of the consequences of IMO 2020 has been a large number of vessels coming out of the fleet to be fitted with scrubbers.
Figures from Alphaliner showed that 212 vessels, comprising 1.8m teu, had been fitted with scrubbers by December, and that another 101 were in yards undergoing retrofits.
Average yard stays for ships undergoing retrofits in 2019 reached 59 days, with 17% of these ships taking longer than 80 days to complete their retrofits. The cost of delays for larger ships is as much as $30,000-$50,000 per day.
This, however, would be partially compensated by the increasing spread between low-sulphur fuel oil and the heavy fuel oil scrubber-fitted vessels will be able to use, which stands at around $250 per tonne.
These ships will be able to enjoy the lower price of standard heavy fuel oil, with current IFO380 bunker price dropping to just $255 per tonne compared with LSFO price of over $510 per tonne.
Figures from Lloyd’s List Intelligence put the idle fleet at 791,611 teu, representing 3.5% of the world fleet by capacity. In terms of number of ships, however, this equates to 310 vessels, or just shy of 6% of the full fleet.
Charter demand
Another consequence, welcomed by non-operating vessel owners, has been a surge in demand for tonnage to replace that being taken out of service for scrubber retrofitting.
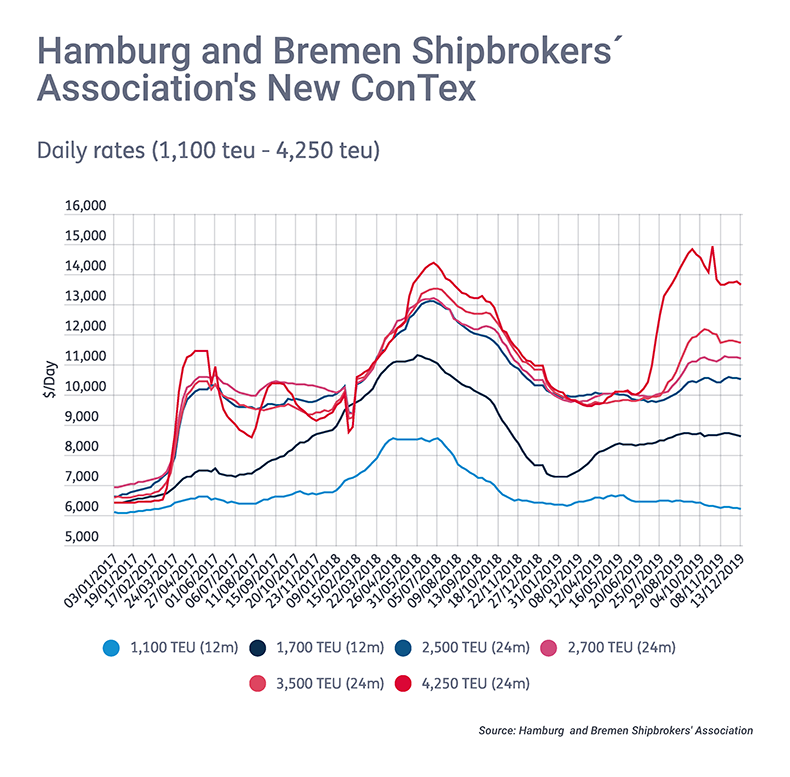
This has mainly occurred in the larger ship segments, where it makes economic sense to retrofit a scrubber. Smaller, older and less efficient ships don’t stand to reap the same benefits as larger, more modern tonnage fitted with scrubbers.
Hence demand for boxships in the charter market has been dominated by vessels of 5,500 teu and over, which continue to benefit from a tight supply environment and strong rates. Alphaliner noted that the “persistent lack of tonnage” in these sizes bodes well for owners when demand picks up again in 2020 following the winter slowdown.
Lay up figures for smaller ships sizes, which is not driven by scrubber fitting, indicates a structural overcapacity in these segments, however.
Demand remains muted, with only the largest classic panamaxes of 4,250 teu or greater size able to lift earnings above last year’s peaks this year.
Going verticalWith consolidation for the most part completed, carriers have had to look elsewhere for their growth. Maersk got the ball rolling back in 2016 when it announced it would focus on being an integrated container logistics company. That move has seen it sell off what it saw as non-core assets and reshape its business in an effort to get closer to its customers. The move is seen as an attempt to alleviate a common problem for carriers: that they are just seen as a commodity service. If a standard container can be put on a standard ship to travel between one port and another, there is little to differentiate one carrier from another. All that differs is the price. By offering factory-to-retailer services, however, carriers can become much more involved in the entire logistics supply chain and bring in value-added services that rivals may not be able to offer. CMA CGM has followed suit in its own way, making a bold move to acquire Swiss 3PL CEVA Logistics for $1.6bn. Chief executive Rodolphe Saadé said the company would now be built on two activities working in tandem, shipping and logistics.
While the integration of CEVA has dragged on CMA CGM’s results, the carrier has taken further steps, recently taking a stake in a delivery firm that will work with CEVA to deliver last-mile services. Some critics point out that this is nothing new, and that carriers owning their own logistics functions is a phase that has gone in and out of fashion as long as there has been containerisation. And some carriers are still content to stick to their knitting, believing that differentiation can be made through offering better service, documentation and reliability. They are content with getting the port-to-port part right, rather than distracting themselves with door-to-door. |